
Variance Report
This is a very important report for restaurants, sweet shops and fast food joints, because recipe is used to maintain inventory inflow and outflow.
In this report you can easily find the differences between your estimated consumption and actual consumption.
This way you can easily catch:
•Mistakes (erroneous data entry)
•Mischief
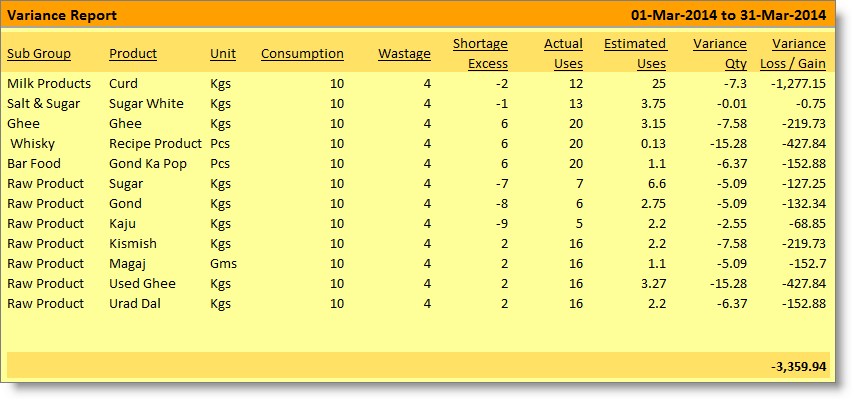
Columns in the Variance Report:
Columns in the variance report are as follows:
Sub Group |
Shows Sub Group name. |
Product |
Shows product name, show only products present in the Consumption, Wastage, Shortage and Excess. |
Unit |
Shows unit name. |
Consumption |
Shows actual consumption quantity entered for the item in give date range. |
Wastage |
Shows actual wastage quantity entered for the item in give date range. |
Shortage Excess |
Shows actual shortage or excess quantity entered for the item in give date range. |
Actual Uses |
Total quantity actually used as per Consumption + Wastage + Shortage / Excess. |
Estimated Uses |
Total estimated usable quantity as per the recipe. |
Variance Qty |
Difference quantity between Actual Uses and Estimated Uses. |
Variance Loss / Gain |
Difference amount between Actual Uses and Estimated Uses. |
Buttons in the Variance Report:
Buttons are explained in Using Reports (Register). Buttons specific to “Variance Report” are discussed here:
F4 Ledger |
To open stock ledger report based on selection. |
^F5 Recipe |
To open product recipe creation screen based on selection. |
Example
Recipe of 1 kg Potato Chips
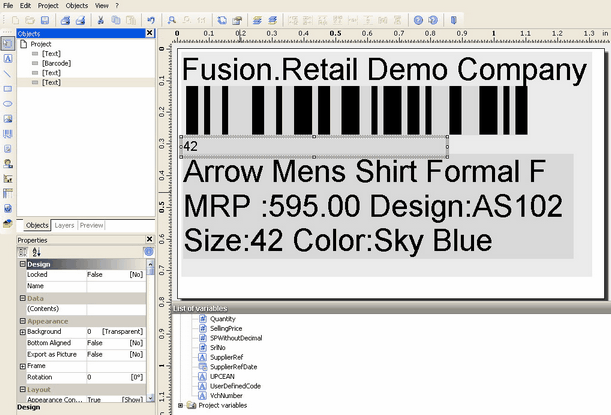
Production department has entered:
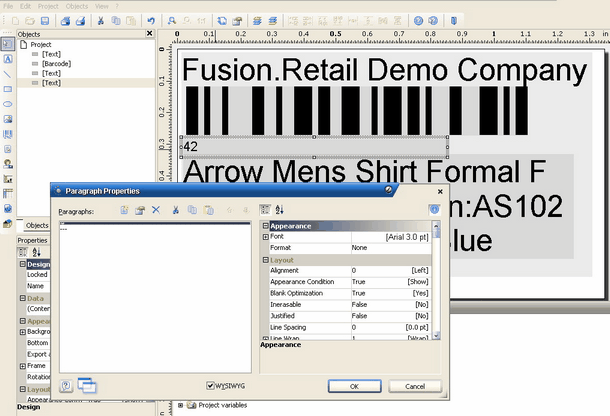
Now go to variance report here you can find the Difference as follows:
As per recipe (Kg) |
As per actual (Kg) |
Difference (Kg) |
|
Potato |
21 |
30 |
9 |
Oil |
3.5 |
5 |
1.5 |
Need a column “Location Name“ in Variance Report
Solution: In Variance Report ( W>F>R ), a column chooser field ‘Location Name’ field has been added.