
Dash Board
Helps you to view Key Performance Indicators (KPI) of all locations on a single screen. It displays Sale, Purchase, Expenses, Stock, Cash, Bank, Markup & Margin, Customer in Dashboard.
It also displays following graphs:
•Location wise Contribution
•Top Categories (Sales)
•Top Suppliers
•Target Vs Achievement (Location wise)
•Target Vs Achievement (Sales Person wise)
•Stock Vs Sale (Location wise)
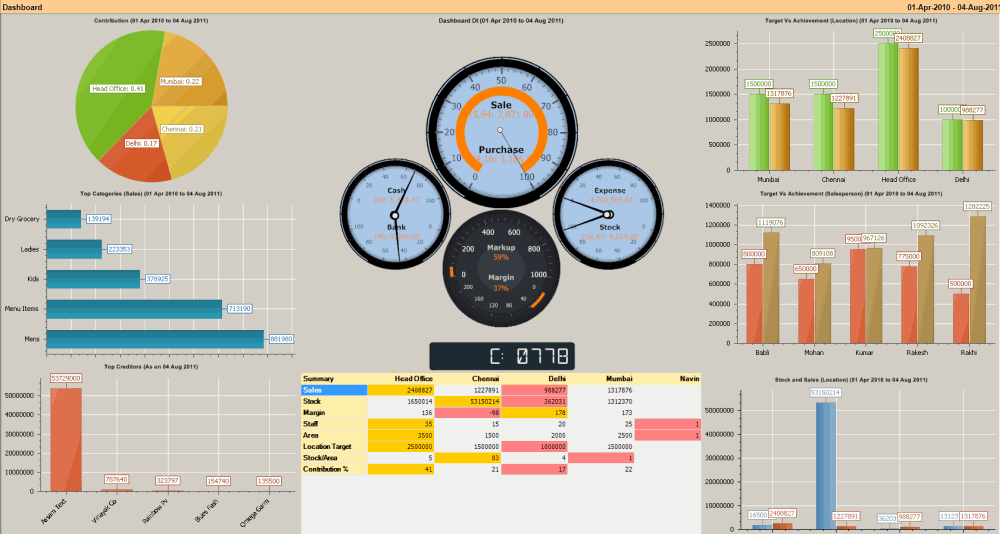
Also displays location wise KPI like Sales, Stock, Margin, Customer, Basket Size, Staff, Sales / Staff, Area, Location Target , Target Vs Achievement, Sales / Area, Stock / Area, Contribution %, Expenses
Buttons in the Dash Board:
F3 2D - 3D |
Change the charts from 2D format to 3D format and vice versa. |